
Our full-service HR solution delivers
Unbeatable support meets innovative technology
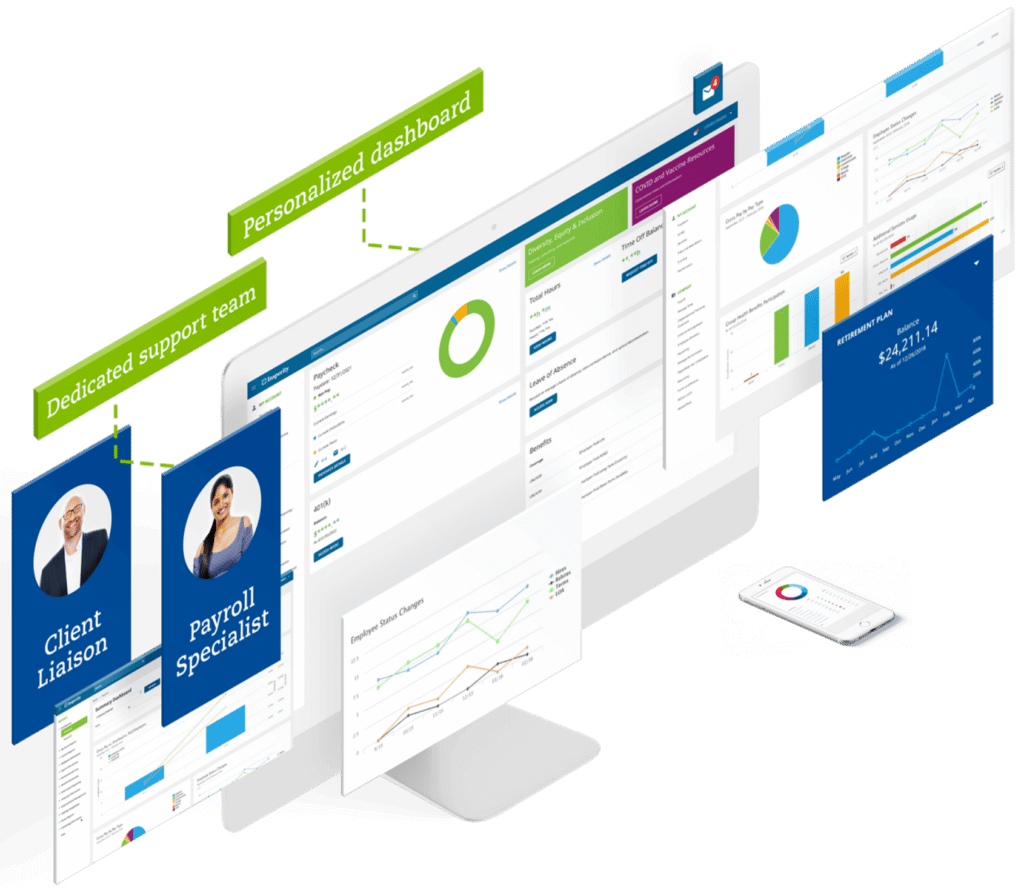
Combine our unmatched service with powerful HR technology, and managing your most important asset ‒ your people ‒ gets a whole lot easier.
Explore the solution that fits your company.
10 reasons why you’ll love our HR technology
Spending more time bogged down in frustrating HR tasks and less on your business? Our human capital management platform eases your burden and supports you and your employees every step of the way.

See how Insperity customers are finding success

“It’s a very customized approach. It’s similar to how we are with our clients. Without them, I don’t think we could scale.”
Matthew Mugar
Co-founder

“Without Insperity, Octane would not have been able to scale and progress as fast as they have.”
Janelle Brunette
Chief Operating Officer

“Insperity also helps us attract investors, and it helps provide that infrastructure that we need to continue our growth trajectory.”
Patrick Cormier
Controller
We support your business with award-winning expertise
Your people are your most valuable resource. When you have better HR support, you will have a better bottom line. We designed our HR support services to lighten your administrative load and maximize your productivity while managing your risks. As your HR solutions company, we give you the tools so you can focus on your growth and gain the upper hand in the marketplace.
Established in
1986
90+
Locations nationwide

Insperity’s overall satisfaction rating

Public in 1997


Helping businesses succeed so communities prosper
Insperity is committed to helping the communities where we work and live through corporate contributions, volunteer efforts, community leadership and social responsibility.
People are talking about us
Want to find out what working with Insperity is really like? Read what our clients are saying about their experience with us.
4.8


on Google

on Google

on Google
Where we are
Coast to coast, our 90+ offices provide personalized, local service when you need it.